A plain guide to chart patterns.
Support and resistance, channels, wedges, triple tops and bottoms, and the two-candle reversals. Each pattern is explained the way you would to a friend over a chart on a phone, then shown on real price history for Brent crude and gold. The honest part: patterns describe, they do not predict.
Three ways in
1Start with what a pattern isA shape price has made before that traders have named, and why they draw lines on charts at all.2See one drawn on real historyEach pattern page has a chart from this site's own price record, with its lines and markers explained.3Read the honest partWhat the pattern is supposed to mean, and the cases most Telegram signals leave out.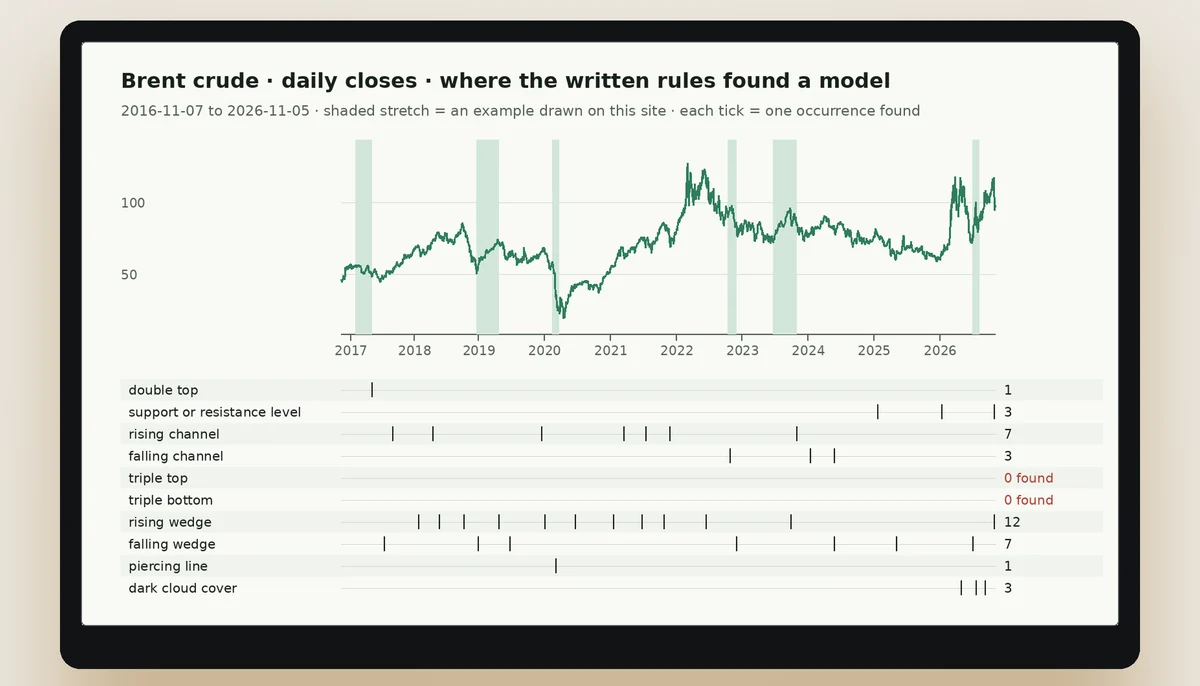
Six pages, each drawn on a real chart
Each card is the stretch of real daily prices on which a written rule found the model, drawn from the history this site keeps for Brent crude (futures), Gold (COMEX futures). Open a card for the full chart and the rule.
- What a pattern isBrent crude (futures) · 5 Jan – 25 May 2017
- Support and resistanceGold (COMEX futures) · 24 Jan 2020 – 7 Jun 2021
- Trend channelsBrent crude (futures) · 19 May – 1 Dec 2023
- Rising and falling wedgeBrent crude (futures) · 19 Nov 2018 – 24 May 2019
- Piercing and dark cloudBrent crude (futures) · 24 Jan – 24 Mar 2020
Six patterns, explained and shown
- What a chart pattern isA shape price has made before and why traders draw lines on charts.
- Support and resistancePrice levels where a market has turned before, and why a level is a zone, not a line.
- Trend channelsTwo roughly parallel lines holding price in between, and what a break out of one is read as.
- Triple top and bottomThree peaks or three lows at about the same level, and the level whose break confirms the figure.
- Rising and falling wedgeTwo trend lines that slope the same way and converge, and why the textbook reading looks odd to beginners.
- Piercing line and dark cloud coverTwo-candle patterns that open beyond the previous candle and close more than halfway back into its body.
How a page here is put together
Think of the way you would explain a chart to a friend on a phone: first you point at the picture, then you say what you are pointing at. Every pattern page does that in order. The chart comes first, directly under the heading, drawn from real daily bars. Hollow candles closed up, filled ones closed down, the pale band is the figure, the lines are the ones the definition uses, and the caption under the chart names the instrument, the source and the date the history was read.
Then come the plain-words explanation, the rule in exact numbers, how many times the rule found the figure in ten years, and what the figure cannot tell you. Nothing on a page is a signal or a target. The honest part runs through all of it: a pattern describes what price did, and the page never says what price will do.
Two markets, both in dollars
The site keeps two price histories. One is Brent crude futures (BZ=F), priced in dollars per barrel, with 2,498 daily bars after cleaning. The other is COMEX gold futures (GC=F), in dollars per troy ounce, with 2,437 bars. Both run from 7 November 2016 to 5 November 2026 and were read once, on 6 November 2026, from Yahoo Finance.
There is no naira price anywhere on the site, and no share index. The charts therefore show moves in dollars, and a reader who looks at a local price will see a different series. Two instruments are a small sample of the world's markets, and the pages say so. They were chosen because both trade through the week in a way a daily rule can read, and because a pattern that appears on a barrel of oil and on an ounce of gold is less likely to be an accident of one series.
Each instrument is named on every chart caption, with a link to the source page for that symbol, so a reader can open the same history and compare. The history ends on 5 November 2026, the last bar the source held when it was read; the figures on the pages will not move unless the site reads the source again and says so on the page.
What the counts say
Over ten years the rules found 2 double tops, 6 support or resistance levels, 12 rising channels and 7 falling channels, 19 rising wedges and 12 falling wedges, 1 piercing line and 3 dark cloud covers, and no triple top and no triple bottom, on either instrument.
The pattern in the counts is the lesson. Figures that need three touches, a prior rise and a closing break come out rare. Figures that only need two converging lines come out common. Wedges are the most frequent here because a narrowing pair of lines is easy to fit; the triple top did not appear, and one reason may be that three highs that close together, between deep troughs, are a lot to ask of a price series. The counts do not rank the figures by how well they work. They show how demanding each written definition is when it meets two real markets over a decade.
A pattern is a rule, and the rule is written in ATR
A pattern on this site is whatever a written rule finds, not whatever the eye prefers. Every size in a rule is in ATR, the average true range of the last 14 sessions: a level's touches must lie within 0.5 ATR; a channel's lines must be 3 to 12 ATR apart; a wedge must narrow to at most 70 percent of its starting gap, which must be at least 3 ATR; a piercing line needs a first body of at least 1 ATR.
Writing sizes in ATR makes the test mean the same thing on a barrel of oil and an ounce of gold, in a calm year and a violent one. It also takes the argument out of drawing: two people applying the rule to the same history get the same figure, which two people with a pencil never do. The cost is strictness. A shape that looks right to the eye but misses a number is not counted, and a page says plainly when no shape met all of them.
A figure counts when a close completes it
Each figure on this site is counted at the moment a closing price completes it, not before. A double top counts when a session closes below the trough; a level when, after its third touch, a close lands at least 2 ATR on the textbook side; a channel when a close leaves its lines; a wedge when a close crosses one of its lines; a candle pair when the second candle closes.
This matters because the same shape drawn before the close is a hope. Traders see two peaks and call a double top while price is still between them; the rule waits. The charts end at or just after the completing close, and nothing after it was used to decide anything. A reader who wants to know what followed will have to look at a platform, and will find that the page deliberately does not say.
The page with no chart
The page about the triple top and the triple bottom has no chart. Rules TT-2 and TT-1 were run over every bar of both series and found no occurrence in ten years. The site could have loosened the rules until some stretch qualified, or borrowed an example from a stock chart, and either would have put a picture on the page. Neither would have been honest.
The finding is narrow: written exactly, these figures did not occur on Brent crude or gold futures between 2016 and 2026. It does not say they never occur elsewhere, and it does not say they mean nothing. Readers who remember a triple top from a signal channel remember a looser picture than the one defined here, and the page is there to show the difference between a picture remembered and a rule applied.
Bars with no range
The source sometimes prints a bar whose high equals its low, an exchange holiday or a month-end day, filled with one price. Such a bar carries no session. Left in the history it would pass for an inside bar and drag down the ATR that every threshold uses. Before any rule runs, the bars with no range are removed: 17 from Brent crude and 77 from gold futures.
The step is the same for every rule and happens before any count, so it cannot favour a result. A reader who compares a chart here with a platform's chart may find a date missing; the stored history shows no trading range on it. What remains is 2,498 bars of Brent and 2,437 of gold, about ten years of sessions each.
What a drawn example leaves out
A chart shows one occurrence, the cleanest by the rule's own measure when there are several, and the caption says how many were found. It leaves out what happened next in any way that could be counted, because counting outcomes needs a definition of success and this site publishes none. It leaves out volume, because the stored history holds open, high, low and close. It leaves out time frames other than the daily one and every market other than these two.
It also leaves out the pattern's reputation. A figure that is famous is not thereby reliable, and a chart with lines drawn on it proves nothing unless the rule behind the lines is stated. These pages state the rule, show one occurrence and stop. What a reader does with a pattern is a separate decision, made somewhere else.
Where the broker page fits
The site links to one broker, FxPro, from the button in the header and from the call to action at the foot of each page. The link is an advertising relationship: if a reader opens an account through it, the site is paid. The broker page explains in plain words what the account is, what a contract for difference is and is not, and what to read in the terms before an account is opened from Nigeria.
A reader who only wants to learn how a wedge or a channel is found needs no account at all, because every rule and count is on the pages. The order ticket on a platform asks for a size and a stop, and the patterns here leave those choices entirely to the reader.
A pattern on a chart is not an order
An order needs a size and a stop, and it is placed on a trading platform. The account this site links to offers the same charts on several platforms, and a practice account costs nothing.