
Triple top and bottom
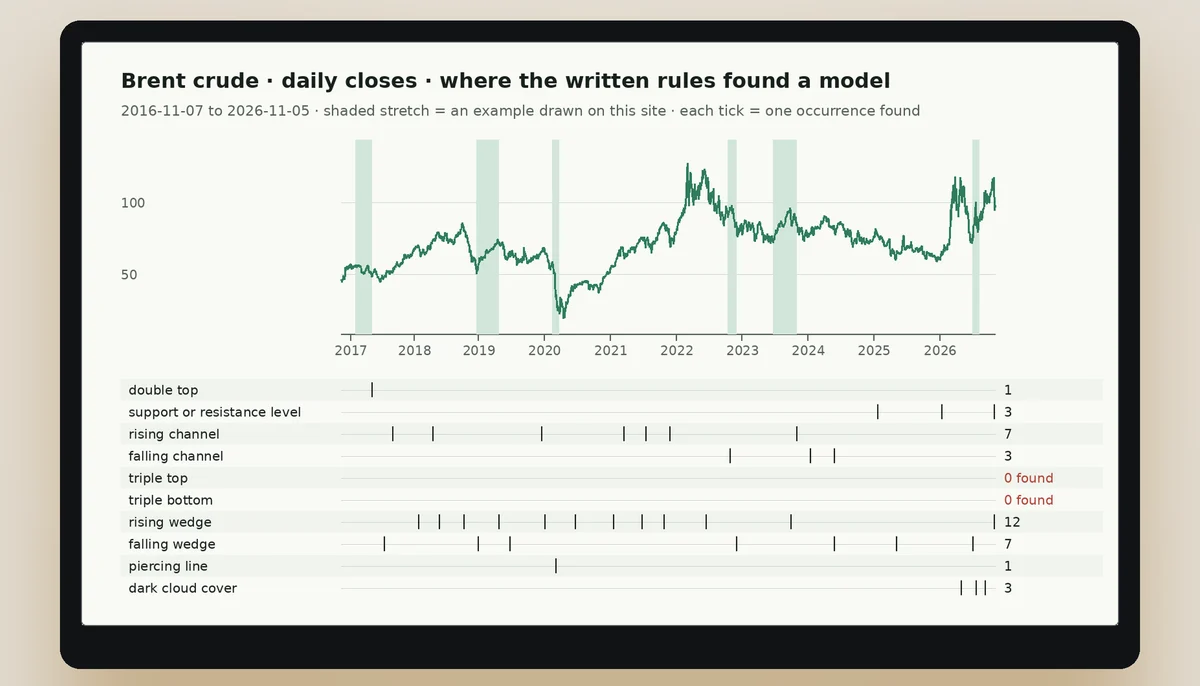
A triple top is a chart figure with three peaks at about the same level, separated by two troughs. A triple bottom is the same shape upside down: three lows at about the same level, separated by two peaks. This page has no chart, and that is the finding: in ten years of daily bars on Brent crude and gold futures, the written rules for the triple top and the triple bottom found none.
How it differs from a double
A double top has two peaks at about the same level; a triple top has three. The third peak is the difference. Some traders see the third peak as a sign that the level is being tested again, and they trust the level less because it has been tested more times. Others see the third peak as a sign that the level is strong because it has held three times.
The same applies to a triple bottom: three lows at about the same level. The third test makes some traders trust the level less, because the more a level is tested, the more likely it is to break. But the break is not guaranteed, and the figure is only confirmed when the neckline is broken.
The exact rule, in numbers
Rule TT-2 (triple top): pivots high-low-high-low-high; the three highs differ by at most 0.15 of the figure's depth, the lowest high minus the higher of the two middle lows; that depth is at least 5 ATR, where ATR is the average true range of the last 14 sessions; neighbouring highs are 10 to 60 sessions apart; the first high came after a rise of at least one depth inside the 80 sessions before it. It counts as formed only when a session closes below the lower of the two middle lows within 30 sessions after the third high, with no close above the highest high in between. Rule TT-1 (triple bottom) is the mirror.
So the neckline is a number the rule can compute, and the figure exists only once a close has broken it.
The neckline and its break
The neckline is the level between the peaks and troughs. In a triple top, the neckline is drawn through the lows between the peaks. In a triple bottom, the neckline is drawn through the highs between the lows. The break of the neckline is read as a confirmation of the figure, because it shows that price has moved beyond the range of the pattern.
The break is not a prediction. It is a description of what has happened at one moment. Price can break the neckline and then return, a move called a false break. The neckline is a line drawn by traders, not a wall that price must respect.
Why a third test makes some traders trust the level less
A third test of a level makes some traders trust the level less because the more a level is tested, the more likely it is to break. Each test brings more sellers at a resistance level or more buyers at a support level, and those orders can be exhausted. When the level breaks, the move can be strong because many traders are forced to close their positions at the same time.
But the third test is not a signal. It is a description of what has happened. The level may hold a fourth time, or it may break. The third test is a fact about the price history, not a promise about the future.
Why this page has no chart
Every other pattern page of this site opens with a real stretch of price history. This one cannot. Rules TT-2 and TT-1 were run over every daily bar of Brent crude futures (2,498 bars) and gold futures (2,437 bars) from 7 November 2016 to 5 November 2026, and found no occurrence of either figure on either instrument. The rules were not loosened to produce one and nothing is drawn by hand.
That absence is informative in one way. Three highs within 0.15 of a depth of at least 5 ATR, with spacing and a prior rise and a closing break all inside the windows, is a demanding shape, and the double top, a simpler figure, was found only twice in the same history. A triple top is a rarer thing than the textbooks suggest, or at least it is rarer on these two series under this definition. The page cannot say which, and it makes no claim about other markets or a looser rule.
Checking the zero yourself
Take a daily chart of Brent crude or gold and look for three highs within a small band, with two troughs between them. Then apply the numbers of rule TT-2: the three highs must differ by at most 0.15 of the figure's depth, that depth must be at least 5 ATR, neighbouring highs must be 10 to 60 sessions apart, a rise of at least one depth must precede the first high, and a close below the lower of the two troughs must follow within 30 sessions. Most shapes that look like a triple top at a glance fail on the depth or on the spacing.
The triple bottom is the same test upside down. A reader who finds a stretch that passes every number is welcome to write to the desk: the rule would then have missed it, and the page would be corrected with a date.
A figure that is often drawn and rarely counted
The triple top is a staple of chart guides, and a reader could be forgiven for thinking it common. This page is a small counterweight. The same history in which the rules found 19 rising wedges and 12 falling wedges, figures that only need two converging lines, produced no triple top and no triple bottom, which need three tests of one level, deep troughs and a closing break.
That is a statement about how demanding the written definition is on two series, not about markets in general. It is also a reminder that a pattern's fame and its frequency are different things, and that a chart with three similar peaks drawn on it may owe its shape more to the eye than to the numbers.
Reading the empty rows
The overview picture on the home page puts the ten models of the site in rows under the line of Brent crude closes. The rows for the triple top and the triple bottom are empty and marked 0 found, next to rows for wedges and channels that carry many ticks. The empty rows are drawn at the same size as the full ones: a result of zero is still a result.
What would change the answer
Three things would change the count: a longer history than ten years, more instruments than two, or a looser rule. This site holds the first two fixed because they are all it has read, and holds the third fixed on principle, since a rule changed after seeing the result measures the change. A reader who runs the same rule on other markets may find occurrences, and the page would be glad to hear it.
Words used on this page
A pivot is a high or a low that stands out from the bars on both sides of it, found by a zigzag of a stated size in ATR, the average true range of the last 14 sessions. Depth is the distance from the troughs to the highs of the figure. A neckline is the lower of the two middle troughs of a triple top, or the higher of the two middle peaks of a triple bottom. Counted means that a close broke the neckline in time. Every word here has a number behind it in the rules quoted above, so that a reader can test a chart with a ruler and a platform.
What this page does not tell you
It does not tell you whether a triple top is a good signal, because no occurrence was found to look at. It does not tell you how often the neckline break was followed by a fall, because there was no break. It does not tell you what the figure would look like on a stock or a currency, because the site holds no such series. What it tells you is narrow and checkable: the rule is stated, the history is named, the count is zero, and the date on which the history was read is on the page. A narrow statement that can be checked is worth more than a wide one that cannot, and the site prefers it.
A note on the neckline
In the textbook drawing the neckline is a clean horizontal line. In the rule it is the lower of the two middle troughs of a triple top, or the higher of the two middle peaks of a triple bottom, and the figure counts only when a close passes it within 30 sessions of the third touch. A close is required, not a wick: a session that dips through the line and closes back above it has not completed the figure. This is the same discipline the double top page applies, and it is why the page can speak of a break without arguing about where a break might have been drawn.
In short
Read next
Questions people ask
What is a triple top?
A triple top is a chart figure with three peaks at about the same level, separated by two troughs. The level between the peaks and troughs is called the neckline, and a break of that level is read as a confirmation of the figure.
What is a triple bottom?
A triple bottom is the same shape upside down: three lows at about the same level, separated by two peaks. The neckline is drawn through the highs between the lows, and a break above it is read as a confirmation.
How does a triple top differ from a double top?
A double top has two peaks at about the same level; a triple top has three. The third peak is the difference. Some traders see the third peak as a sign that the level is being tested again, and they trust the level less because it has been tested more times.
What is the neckline?
The neckline is the level between the peaks and troughs. In a triple top, it is drawn through the lows between the peaks. In a triple bottom, it is drawn through the highs between the lows. A break of the neckline is read as a confirmation of the figure.
Why does this page have no chart?
Because the written rules for the triple top and the triple bottom found no occurrence in ten years of daily bars on Brent crude and gold futures. The page says so instead of drawing something that does not meet the rules.
A pattern on a chart is not an order
An order needs a size and a stop, and it is placed on a trading platform. The account this site links to offers the same charts on several platforms, and a practice account costs nothing.